Intro
I’d like to start by saying that this implementation was done as a test for the flow itself, what was picked was merely for demoing. IRL the use case is different, the flow remains the same, now I can get started.
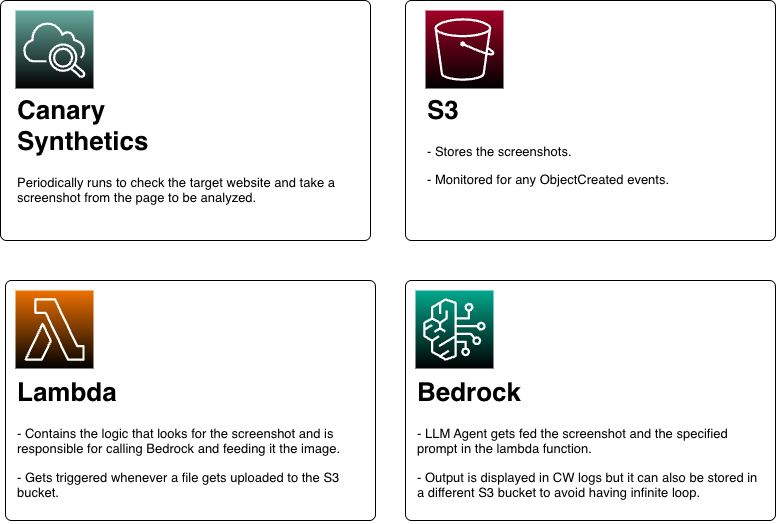
AI Image overview takes an image as an input, sends it to Bedrock LLM, gets the description, that’s it in a nutshell.
Prerequisites
- CloudWatch Synthetics Chrome browser plugin
- An S3 Bucket to store the screenshots (Will also be used as a source that will trigger the lambda function which invokes Bedrock).
Implementation
1. Canary Synthetics
- Used for monitoring periodically which is why it’s great for this use case because the idea is to have weekly screenshots from specific dashboard.
- Blueprint used was Canary Recorder which allows you to record your actions on a specific website and it repeates those actions for you.
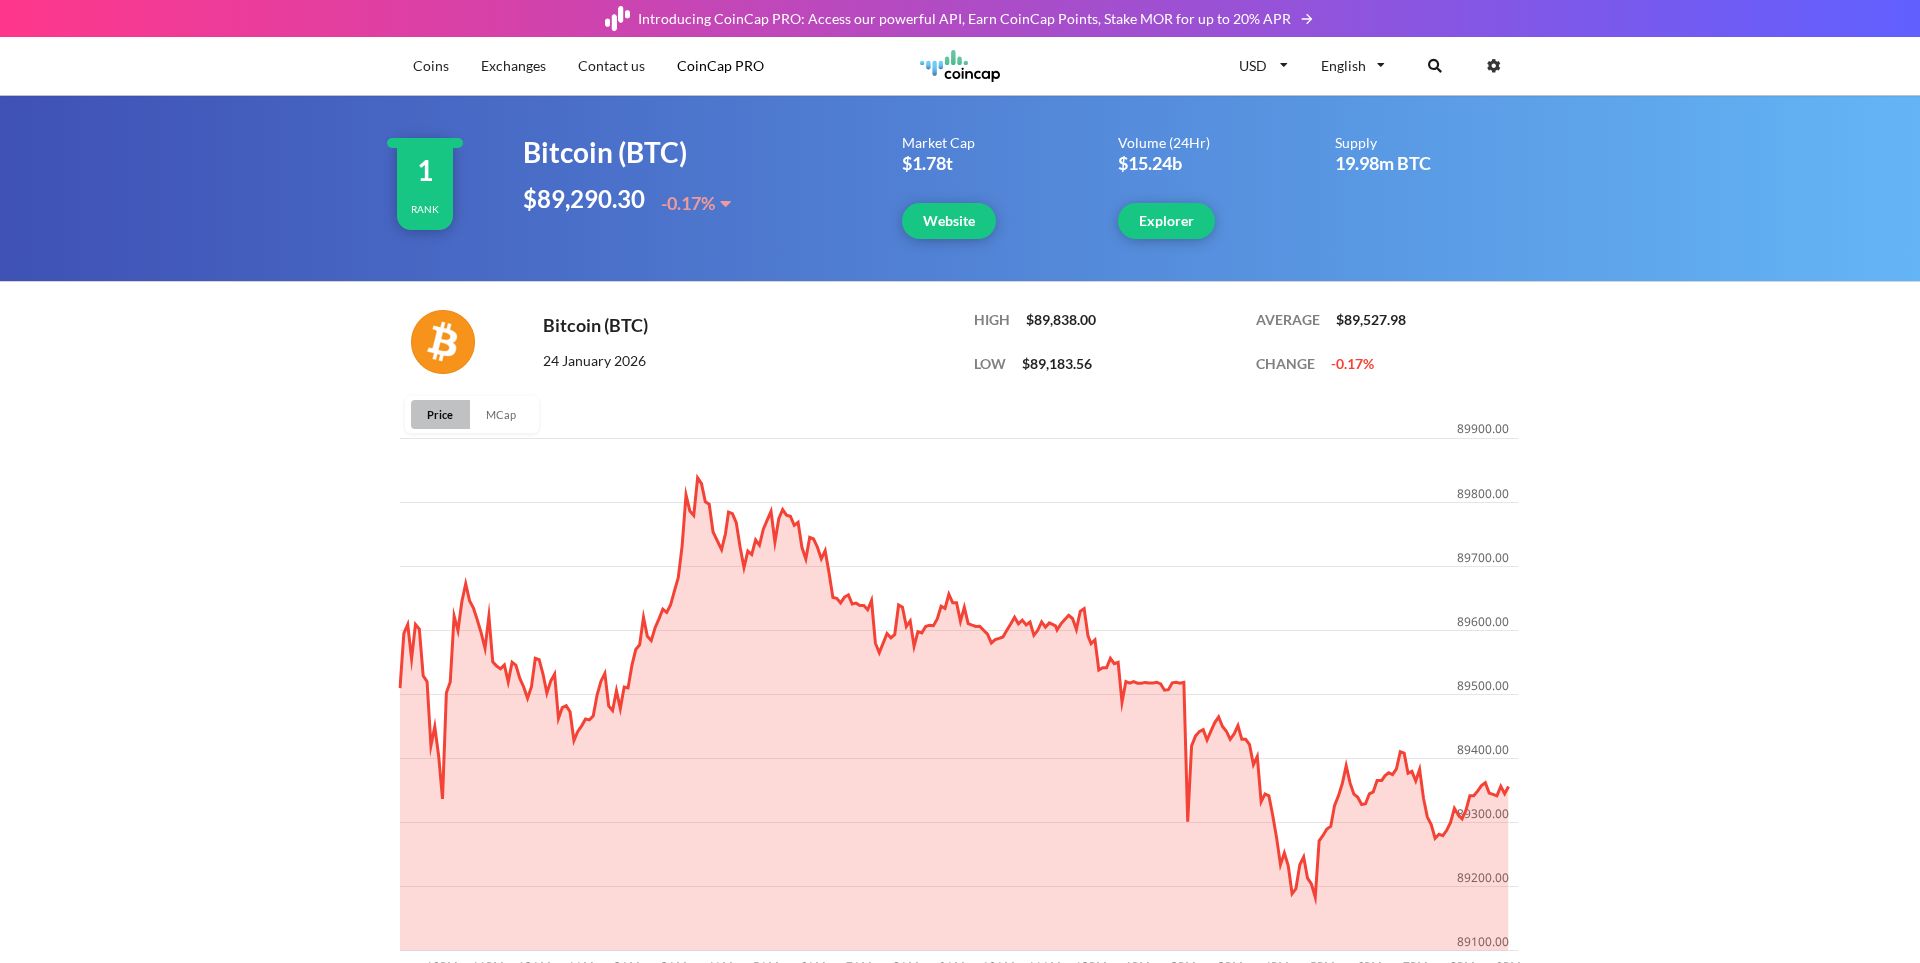
- Source script can be found here and what it does is that it reaches to coincap, gets the Bitcoin page and screenshots it.
2. Lambda
- Configured with the created S3 bucket as a trigger so that whenever canary synthetics run, the lambda function also runs since files were uploaded to S3.
- S3 event is checked and we extract the current path of the screenshot so that we describe the correct image for each run.
- Needs permissions to access the S3 Bucket and Bedrock.
3. Bedrock
- Gets invoked via Lambda and is the service used to describe what’s in that image.
Outcome
- Sceenshot gets taken and stored in S3 (Via Canary Synthetics)
- The Bedrock model now returns the following based on our prompt
prompt = """
You are a crypto expert.
Analyze the provided screenshot and generate a concise, technical summary for where Bitcoin is heading. Respond in the following JSON format:
{
    "current_price_usd": "Current price of Bitcoin in USD.",
    "summary": "Overview of where you think the market is heading based on the current chart, whether its the right time to buy or not."
}
"""
{
  "current_price_usd": "$89,290.30",
  "summary": "Bitcoin is showing a downward trend with a 0.17% decrease. The price chart displays significant volatility with the price having reached a high of $89,838.00 and a low of $89,183.56 in the current period. The market appears to be in a short-term consolidation phase after testing higher levels around $89,800. Given the recent pattern of lower highs and the current price action showing resistance to upward movement, Bitcoin may experience further short-term pressure. However, with substantial market cap ($1.78T) and trading volume ($15.24B), the asset remains fundamentally strong. This minor pullback might present a strategic entry point for those looking to accumulate, though traders should watch for a potential break below $89,000 which could signal further downside."
}
References
So far, the implemntation was done through the console, later I’ll try to automate it with IaC tool.
Big thanks to Kiro IDE.
Ciao.